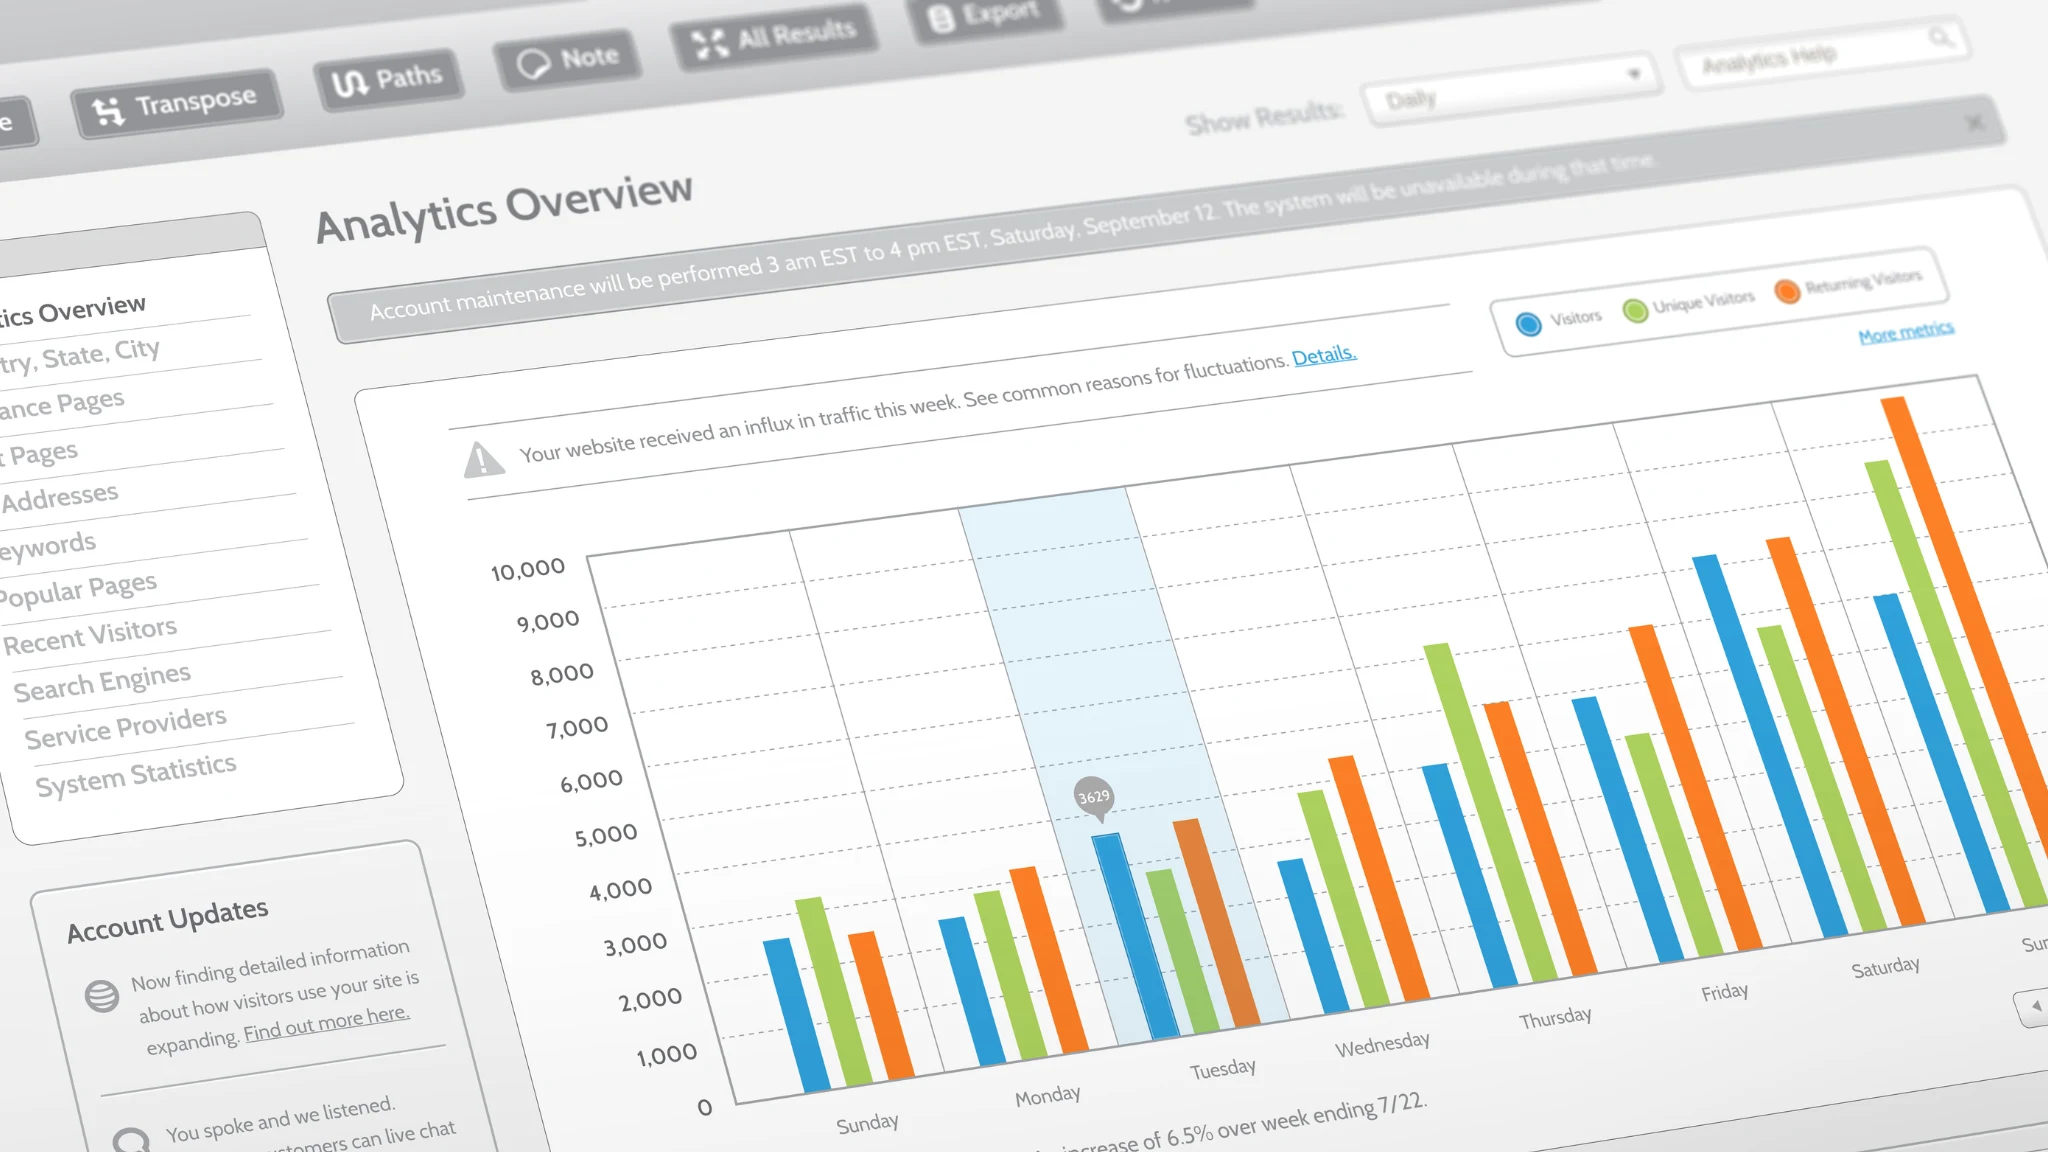
If you’ve been struggling to find a proper landing page report in GA4, you’re not alone. Unlike Universal Analytics, GA4 doesn’t come with a default landing page report. But the good news is — you can build one easily using the Explore (Free Form) feature.
In this guide, we’ll walk you through how to create a custom landing page report inside GA4, complete with session data, active users, bounce rate, conversion events, and even organic filters — step by step.
Why You Need a Custom Landing Page Report
Landing pages are often the first point of contact for your users. Understanding their performance helps you:
- Identify top-converting entry points
- Understand traffic channel efficiency
- Spot underperforming content
- Optimize for SEO and paid campaigns
Since GA4 doesn’t offer this view out-of-the-box, the best alternative is building it using Explorations.
Step-by-Step: Building a Landing Page Report in GA4
1. Go to “Explore”
Start by navigating to the Explore tab in GA4 (located in the left-hand menu). Choose the Blank template and stick with the Free Form technique. This gives you full control over your dimensions and metrics.
2. Add Dimensions
Click the “+” icon under the Dimensions panel and add the following:
- Landing Page – This refers to the basic URL users first landed on.
- (Optional) Landing Page + Query String – If you’re tracking custom UTM parameters or dynamic URLs, this one includes them.
You can use both, and even create two separate tabs to compare clean URLs vs query-string URLs.
- Session Default Channel Group – This allows you to filter traffic sources (e.g., Organic Search, Paid Ads, Social).
Click Import once selected.
3. Add Metrics
Now click the “+” under Metrics and import the following KPIs:
- Sessions
- Active Users
- Engagement Rate
- Key Events (Conversions)
- Session Conversion Rate
- Bounce Rate (optional, but insightful)
These metrics give you a high-level overview of both traffic and engagement.
Click Import after selection.
4. Set Rows & Values
- Drag Landing Page to Rows
- Drag all the selected Metrics to Values
If you want to analyze by channel, you can also drag Session Default Channel Group into Rows or Filters depending on your use case.
5. Sort by Sessions
Sort the report by Sessions (descending) to quickly identify your most visited landing pages. You’ll also see supporting metrics like bounce rate and conversions side-by-side for each page.
6. Save and Rename
Give your exploration a name, like Landing Page Report. This will save the layout so you can reuse or edit it later.
Bonus: Create an Organic Traffic–Only Report
Want to analyze just Organic Search traffic?
Here’s how:
- Duplicate the current tab inside your Exploration.
- Click Filters > Add Filter
- Select:
- Dimension: Session Default Channel Group
- Match Type: Exactly matches
- Value: Organic Search
- Apply
Now you have a report that shows only sessions and conversions coming from Organic Search — a great way to track SEO performance.
Optional: Add Additional Tabs
You can create additional tabs in the same report for:
- Paid Traffic (filter by “Paid Search” or “Google Ads”)
- Social Traffic (filter by “Organic Social”)
- Query String–based Landing Pages
- Geo or Device Breakdown
This lets you analyze multiple perspectives of your landing page performance — all in one place.
Recap: Why This Matters
GA4’s default reports can feel limiting, but with Explorations, you gain deep flexibility. By building this custom landing page report, you can:
✅ Track high-performing content
✅ Identify SEO opportunities
✅ Spot pages with low engagement or conversions
✅ Make data-driven decisions on UX and CRO
Useful Resources
Final Thoughts
Custom landing page reporting in GA4 doesn’t just help you look at traffic — it helps you take action.
Whether you’re running a marketing agency or managing an in-house analytics setup, mastering Explorations in GA4 is a must for data-backed strategy.
Written by Qausain Anwar
Founder of www.branxhq.com
Helping brands scale with smart SEO & analytics that actually convert.


